


H. Hasan-Ali,1 M.H. Maghraby,2 D.A. Fouad 1 and A.A. Abd-Elsayed3
تصحيح تشتت QT يحسن الأداء التشخيصي لاختبار التمرين في تشخيص مرض الشريان التاجي
حسام حسن علي، محمد مغربي، دعاء فؤاد، علاء عبد السيد
الخلاصـة: لتحديد أفضل مزيج من العوامل الثابتة التي تحسّن الأداء التشخيصي لاختبار التمرين، أُجري تصوير الأوعية التاجية واختبار التمرين لـ 112 مريضاً مصابين بالذبحة الصدرية وكان مخطط كهربية القلب لديهم سليماً. وتضمَّنت المنبئات الأحادية المتغير لمرض الشريان التاجي: العمر أكبر من يساوي 40 عاماً، الجنس الذكري، فرط ضغط الدم، التدخين، نشأة ألم صدري نتيجة لبذل المجهود، انخفاض ضغط الدم الانقباضي أكبر من أو يساوي 10 مليمتر زئبقي، أو يكون ضغط الدم الانقباضي بعد 3 دقائق من أداء التمرين أعلى من %90 من الذروة، وانخفاض معدل نبض القلب لأقل من 120 نبضة في الدقيقة بعد دقيقة من أداء التمرين، أو ظهور انخفاض في ST بسبب التمرين بعد دقيقة أو أكثر. وأظهر تحليل التحوف اللوجستي العديد المتغيرات أن استخدام أي من انخفاض ST أكثر من أو يساوي مليمتر واحد أو زيادة QTDc في ذروة التمرين أكثر من 70 ملي ثانية سيحسن بدرجة ملموسة قيمة الحساسية والتنبوء السلبي للاختبار بدون زيادة ملموسة في النوعية.
ABSTRACT: To determine the best combination of parameters that would improve the diagnostic performance of exercise testing, coronary angiography plus exercise testing were done on 112 patients with angina pectoris and normal electrocardiogram. The univariate predictors of coronary artery disease included: age ≥ 40 years, male sex, hypertension, smoking, development of exertional chest pain, decrease in systolic blood pressure (BP) ≥ 10 mmHg or systolic BP 3 min post-exercise > 90% of peak, heart rate drop < 12 beats/min 1 min post-exercise, exercise-induced ST-segment depression ≥ 1 mm. Multivariate logistic regression analysis showed that using either ST depression.
Amélioration de la performance diagnostique de l’épreuve d’effort aux fins du diagnostic de coronaropathie grâce à la dispersion du QT corrigée
RÉSUMÉ: Afin de déterminer la meilleure combinaison de paramètres permettant d’améliorer la performance diagnostique de l’épreuve d’effort, une angiographie coronarienne et une épreuve d’effort ont été pratiquées sur 112 patients présentant un angor et un électrocardiogramme normal. Les facteurs prédictifs univariés de la coronaropathie étaient les suivants : âge supérieur à 40 ans, sexe masculin, hypertension, tabagisme, apparition de douleurs thoraciques à l’effort, baisse de la tension artérielle (TA) systolique supérieure à 10 mmHg ou de la TA systolique trois minutes après l’effort de plus de 90 % de la valeur maximale, chute de la fréquence cardiaque à moins de 12 pulsations/min une minute après l’effort, et dépression du segment ST induite par l’effort de plus de 1 mm. L’analyse de régression logistique multivariée a montré que l’utilisation de la dépression du ST de plus de 1 mm ou de.
1Department of Cardiovascular Medicine;
2Department of Internal Medicine, Assiut University Hospital;
3Department of Public Health and Community Medicine, Assiut University, Assiut, Egypt (Correspondence to A.A. Abd-Elsayed:
EMHJ, 2010, 16(1):75-81
Introduction
The exercise electrocardiogram (ECG) is used in the evaluation of symptomatic patients to predict the presence and extent of coronary artery disease (CAD) [1,2]. Although a large number of non-invasive stress testing modalities are currently available, the ECG is still used as standard because it is the least costly of all provocative non-invasive tests [3]. The conventional criterion for designating an exercise test abnormal is demonstration of > 1 mm of slow upsloping or horizontal or downsloping ST-segment. However, when exercise-induced ST-segment change is used as a single criterion for ischaemia, its value is limited by low sensitivity and specificity [1–4]. An alternative to using more expensive tests would be the more efficient use of available low cost data. Several parameters have been studied in a number of reports to improve the sensitivity, specificity and predictive value of the exercise stress test [4–18].
This study was designed to determine the best combination of parameters, clinical and exercise-induced haemodynamic and electrocardiographic, that would improve the capacity of exercise testing in diagnosing CAD with best sensitivity and specificity.
Methods
The study group comprised all 112 patients presenting to our hospital during the period February 2006–October 2006 with typical (definitive) or atypical (probable) angina associated with normal or non-conclusive electrocardiographic changes for the diagnosis of CAD and who gave informed consent to participate in the study. The protocol of the study was fully explained to all participants.
Chest discomfort was classified as follows:
typical angina (definitive) which meets all the 3 of the following criteria: substernal chest discomfort with characteristic quality and duration; provoked by exertion or emotional stress; and relieved by rest or nitroglycerine;
atypical angina (probable), which meets 2 of the above 3 criteria; non-cardiac chest discomfort which meets ≤ 1 of the above criteria [19].
Patients were excluded if they had current unstable angina, documented previous myocardial infarction, a prior revascularization procedure, ejection fraction < 50%, valvular or congenital heart disease or haemoglobin level 85% of age-predicted heart rate (HR) during the test without evidence of positivity in their exercise ECG (inadequate test).
Exercise stress test
Before the test the patients had to be free of chest discomfort for at least 1 week, stop anti-anginal, anti-arrhythmic and antipsychotic drugs (each drug according to its half-life), and fasting (with no cigarette smoking) in the previous 3 hours. Standard Bruce protocol was used for all patients [20]. The test was stopped if the target heart rate (HR) was achieved or on the occurrence of any of the following: exertional hypotension, limiting symptoms (chest pain, evidence of poor peripheral perfusion, dyspnoea, fatigue or leg cramps); ST-depression > 3 mm; bundle branch block; or serious arrhythmias (multiform complexes, couplets, triplets, salvos or ventricular tachycardia).
The following variables were measured during the stress test:
Basic data: resting HR, resting systolic blood pressure (BP), maximum HR achieved, duration of exercise, peak systolic blood pressure, and chest pain with exertion.
Abnormal BP response (either systolic BP fails to increase > 130 mmHg or decreases by > 10 mmHg in response to exercise) [5]; systolic BP at 3 minutes post exercise; > 90% of peak exercise systolic BP [6].
Abnormal HR response (either HR at peak exercise 12 beats at 1 minute post exercise from peak exercise value [7]).
ST segment changes (measured in ≥ 6 beats) occurring peak exercise and/or during recovery; > 1 mm horizontal or downsloping depression measured 80 ms from the J-point, > 1.5 mm upsloping depression measured 80 ms from the J-point, or > 1 mm elevation in > 2 contiguous leads except aVR [3].
ST/HR index > 1.6 µV/beats/min (measured in the lead with the maximum ST depression, in ≥ 6 beats) as ST depression at peak stress divided by the difference between the peak exercise HR and resting HR [8–10].
ST/HR slope: a linear regression-based computed measurement [ST depression = dependent variable; HR = independent variable. Both are measured in each lead (excluding aVR, aVL and V1) at the end of each stage and at peak exercise]. A linear regression analysis is made for each lead: the maximal ST/HR slope is recorded and the highest ST/HR slope with a statistically significant correlation coefficient among all leads is taken as the final result. ST/HR slope ≥ 2.4 µV/beats/min is considered an indicator of the presence of CAD [9,10].
Abnormal T-wave response (measured in ≥ 6 beats); increased T-wave amplitude in V2 > 2.5 mm [11] or T-wave inversion with exercise in V5 (< 5 mm or ≥ 5 mm) [12]
Lengthening or no change in P-wave duration in V2 at peak exercise (measured in ≥ 6 beats) is considered positive, while shortening is considered negative [13].
Q-wave depth in lead V5 (measured in > 6 beats). This is considered positive if absent both at rest and at peak exercise, present at rest but with no change with exercise, or present at rest but decreases or disappears with exercise. It is considered negative if absent at rest but appears with exercise, or present at rest and increased by exercise [14].
Decreased R-wave amplitude > 1 mm [4] or increased ≥ 2 mm [15] at V5 at peak exercise compared to resting value (measured in ≥ 6 beats) is considered positive.
QT dispersion (QTD): QT interval was measured manually in as many pericardial and limb leads as possible (≥ 8 leads) after being magnified on a Cannon photocopier (× 3). It is measured from the onset of Q-wave to the end of T-wave. If the end of T-wave is not seen, for example when it is fused with the U-wave or P-wave as in the setting of rapid HR, a straight line is drown tangential to the down stroke of the T-wave till it meets the base line (identified from level of PR segment) and this is taken as the end of the T-wave. QTD is the difference between the highest and the lowest QT. The test is considered positive if QTD at peak exercise is > 60 ms [16].
Delta QTD (from rest to peak exercise) > 16 ms. [17].
Corrected QT dispersion (QTDc) at peak exercise: QT interval (QT) is measured in as many pericardial and limb leads as possible (≥ 8 leads) as mentioned. Corrected QT (QTc) is calculated from Bazett’s equation: QTc = QT/(√RR interval). QTDc is the difference between the highest and the lowest QTc. The test is considered positive if QTDc > 70 ms [16].
Q-X/QT ratio > 0.5 measured in V5 in ≥ 6 beats (Q-X measured from the beginning of QRS to crossing of ST) [18].
Coronary angiography
Coronary angiography was carried out within a maximum of 90 days from the exercise test. Multiple views were taken for both the left and right coronary arteries to achieve complete visualization of all coronary segments from ≥ 2 orthogonal planes. The coronary artery was considered diseased if stenosis was ≥ 50% diameter.
Statistical analysis
All data were analysed using SPSS, version 11. Continuous variables were expressed as mean and standard deviation (SD) and discrete variables were presented as frequencies and percentages. Continuous variables were compared between the 2 groups (with and without CAD) using the unpaired Student t-test for normally distributed data and the Mann–Whitney U-test for non-normally distributed data. Discrete variables were compared using the chi-squared test with Fisher exact correction. Statistical significance was set at P < 0.05.
Variables with a significant difference between the ischaemic and non-ischaemic groups were considered univariate predictors of the presence of CAD. Validation of these variables was tested by computing the sensitivity, specificity and positive and negative predictive values.
The categorical univariate predictors of CAD were entered into multivariate, stepwise, logistic regression analysis to identify independent predictors. Only variables with P < 0.05 were eligible to enter the stepwise analysis and be retained in the final model. Validation of the model was also tested using the Holmer–Lemeshow goodness-of-fit statistics across groups of risk. To determine the cut-off point for a positive test according to the above model, a receiver-operating-characteristic (ROC) curve was plotted for the predicted probability of each case in the study group. Sensitivity, specificity and positive and negative predictive values were compared using the McNemar test.
Results
The mean age of the patients was 46 (SD 9) years. There were 81 (72%) males, 47 (42%) participants with hypertension, 26 (23%) with diabetes, 60 (54%) smokers and 85 (76%) who had had typical chest pain. Based on coronary angiography, significant CAD (> 50% stenosis) was present in 57 (51%) participants: 21 (19%) had single vessel, 8 (7%) had 2-vessel, 28 (25%) had 3-vessel disease. The remaining 55 participants (49%) did not have significant CAD.
All those with a negative test achieved ≥ 85% of the age-predicted HR with exercise. We were able to measure V5 variables in 110 (98%) participants; peak exercise QT, QTD, QTc, QTDc was measured in 109 (97%) patients. All missing values were from those in the non-CAD group.
Predictors of CAD
Compared to those without CAD, patients with CAD had higher mean peak exercise QT interval [327 (SD 40) versus 272 (SD 28)] (P < 0.001), QTD [61 (SD 21 versus 38 (SD 10)] (P < 0.001), QTc interval [485 (SD 36 versus 435 (SD 29)] (P < 0.001), QTDc [52 (SD 47) versus 33 (SD 30)] (P < 0.001). The univariate predictors of CAD are shown in Table 1.
Table 1 Univariate predictors of coronary artery disease (CAD)
The statistically significant univariate predictors of CAD were entered into a multivariate, stepwise, logistic regression analysis to determine the best diagnostic model. The independent predictors of CAD were horizontal or downsloping ST depression ≥ 1 mm and peak exercise QTDc > 70 ms (Table 2).
Table 2 Multivariate stepwise logistic regression analysis for prediction of coronary artery disease (CAD)
The Holmer–Lemeshow goodness-of-fit statistic across groups of risk was not statistically significant (P = 0.89) indicating little departure from a perfect fit. The area under the ROC curve for the predicted probability of each case in the study group from this multivariate model was 0.94. The cut-off point of the predicted probability for a positive test according to the above model was obtained from the ROC curve. The cut-off point of the predicted probability of the model was 0.39 with the best sensitivity (93%) and specificity (85%) (Table 3). The predicted probability from the above model was computed from the following equation: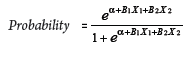
where, α is the constant (intercept) of the regression model, B is the B coefficient of the variables, X is the value of the variable (0 when absent, 1 when present).
This predicted probability ≥ 0.39 can be achieved when ≥ 1 variables in the equation are positive. So, according to the above model, the presence of horizontal or downsloping ST depression ≥ 1 mm and/or peak exercise QTDc > 70 ms is an indication of a positive test.
Table 3 Sensitivity and specificity of the predicted model at different predicted probabilities
To study the additive effect of both independent variables in the model, 3 logistic regression models were created, 1 for each independent variable alone and 1 using either or both variables as an indication of a positive test. The discriminative ability of the 3 models was compared by computing the area under the ROC curve for each. Sensitivity, specificity, positive and negative predictive values were computed for each and compared to those of ST depression to make a simple numerical comparison (Table 4). Adding peak exercise QTDc > 70 ms to horizontal or downsloping ST depression ≥ 1 mm in the diagnosis of CAD during the interpretation of the exercise test significantly improved the sensitivity (70% to 93%; P < 0.001) and the negative predictive value of the test (75% to 92%; P < 0.01) with no significant decrease in the specificity.
Table 4 Validity of the additive effect of the 2 variables in the logistic regression model for the detection of coronary artery disease (CAD), single vessel disease (SVD) and multi-vessel disease(MVD)
The validity indices were higher for the peak exercise QTDc compared to ST depression but the differences were not statistically significant.
The additive effect of the independent variables in the model was re-tested in the detection of single vessel disease as well as multi-vessel disease (Table 4). ST depression had a lower sensitivity in single vessel (57%) than in multi-vessel disease (78%; P < 0.01), with specificity 91% for both. Similarly, peak exercise QTDc had sensitivity 81% for single and 78% for multi-vessel, with specificity 92% for both. The diagnostic accuracy was even better than ST depression in single vessel disease, as indicated from the greater area under the ROC curve (0.87 versus 0.74) and higher sensitivity (81% versus 57%; P < 0.001). Although the specificity and predictive values were higher, the differences were not statistically significant. In single vessel disease, adding peak exercise QTDc to ST depression offered advantages over QTDc alone. In multi-vessel disease the diagnostic accuracy of the test improved (area under ROC curve 0.97, which is higher than either alone). The sensitivity and negative predictive value in multi-vessel disease increased significantly to 100% with no significant decrease in specificity.
Discussion
The exercise test has a reported sensitivity of 50%–70% and specificity of 70%–90% using conventional ST depression criteria with exercise [3]. In a meta-analysis, mean sensitivity was 68% (range 23%–100%) and mean specificity 77% (range 17%–100%) [1]. In our study, sensitivity was 86% and specificity 44%. This relatively high sensitivity is attributed to the use of 50% angiographic stenosis as a reference standard for the presence of CAD and measurement of ST depression at peak exercise and/or during recovery, which improves test sensitivity. Recovery-onset ST depression has been reported to represent about 30% of ischaemic ECG response with exercise [21].
Another explanation could be referral bias as the participants included patients with typical and probable ischaemic chest pain. Referral bias was reported to be the most important factor increasing sensitivity and decreasing specificity [2]. This referral bias is ethically unavoidable as coronary angiography could not be done for patients with atypical, likely non-ischaemic, chest pain and negative exercise test. Horizontal or downsloping ST depression > 1 mm had a significantly lower sensitivity (70%) and a higher specificity (91%). Sansoy Watson and Beller similarly reported that adding upsloping ST-segment depression increased sensitivity at the expense of specificity and a significant decrease in the positive predictive value of the test [22]. Also, in a more recent report, both rapid and slow upsloping ST depression were found to be associated with very low likelihood of CAD compared to horizontal or downsloping ST depression [23]. Similar to previous reports [1,2], we found that in single vessel disease, ST depression had a lower sensitivity than in multi-vessel disease, with a similar specificity.
Normally, the QT interval (corrected for HR) shortens with exercise [24]. Some investigators have found that this interval fails to shorten, or lengthens, when ischaemia is present [18,25]. They have also reported a higher Q-X/QT ratio in CAD patients with no additive value to ST segment criteria in terms of sensitivity and specificity [18,25]. QT interval difference with age and sex is not thought to affect its usefulness in exercise ECG. This is based on previous findings that sex differences in QT disappear at HR ≥ 110 beats/min, whereas age differences are smaller but are present throughout exercise, with no significant age–sex interaction [26]. Moreover, QTD, QTDc and/or their differences between rest and peak exercise have emerged as useful additional diagnostic criteria in the interpretation of the exercise test, irrespective of sex [16,17,26,27].
Exercise QTD > 60 ms has been found to be a clinically useful indicator of significant coronary stenosis independent of sex or the presence or absence of significant exercise-induced ST-segment depression [26] and in patients who do not have exercise-induced chest pain or significant ST-segment depression [27]. It has been reported in a study on female patients to have a significantly higher sensitivity and specificity for the diagnosis of CAD compared with 1-mm ST-segment depression. When a QTD > 60 ms was added to ST-segment depression as a condition for a positive test, the specificity increased to 100% [16]. Also, it has been reported to have a greater sensitivity and specificity than ST depression in the detection of restenosis after percutaneous coronary angioplasty at ≥ 50 ms [28]. Adding QTD ≥ 60 ms to ST depression improved the diagnostic value of the exercise test in diagnosing restenosis after percutaneous coronary angioplasty [29]. A rise of QTD with exercise ≥ 16 mm was another predictor of CAD [17]. Exercise QTDc of > 70 ms significantly increased the sensitivity of exercise testing for CAD; in addition, combining with ST-segment depression gave a specificity of 100%. Both QTD and QTDc were measurable with an acceptable reproducibility [16]. Similarly Ozdemir et al., in a study of a series of female patients, have reported that QTDc with a different cut-off point of a positive test (> 60 ms) had a greater sensitivity and specificity than ST-depression [30].
In our study, peak exercise QTD > 60 ms, delta QTD rest to peak exercise ≥ 16 mm, QTDc > 70 ms and Q-X/QT ratio in V5 > 0.5 were significantly higher in CAD patients. Q-X/QT ratio in V5 > 0.5 had the lowest sensitivity and specificity. The other 3 parameters had high specificity but differed in sensitivity, high for QTDc > 70 ms and low for QTD > 60 ms and delta QTD.
Peak exercise QTDc and horizontal or downsloping ST depression were the only variables found to be independent predictors of CAD in multivariate analysis. The validity indices, despite being higher for peak exercise QTDc compared to ST depression, were not statistically significant. The diagnostic accuracy of QTDc was even better than ST depression in single vessel disease, as indicated by the greater area under the ROC curve and better sensitivity. We showed that using either variable as a marker of a positive exercise test significantly improved the sensitivity and negative predictive value of the test without a significant decrease in the specificity.
In conclusion, clinical and exercise-induced haemodynamic and ECG changes could provide additional information that could increase the ability of the exercise test to diagnose CAD. Using either horizontal or downsloping ST depression ≥ 1 mm or QTDc peak exercise > 70 ms as a marker of a positive exercise test significantly improves the diagnostic value of the test.
References
- Gianrossi R et al. Exercise-induced ST depression in the diagnosis of coronary artery disease. A meta-analysis. Circulation, 1989, 80:87–98.
- Detrano R et al. Exercise-induced ST segment depression in the diagnosis of multivessel coronary disease: a meta analysis. Journal of the American College of Cardiology, 1989, 14:1501–8.
- Tavel ME. Stress testing in cardiac evaluation: current concepts with emphasis on the ECG. Chest, 2001, 119:907–25.
- Cheng SL, Ellestad MH, Selvester RH. Significance of ST-segment depression with R-wave amplitude decrease on exercise testing. American journal of cardiology, 1999, 83:955–9.
- SanMarco ME, Pontius S, Selvester RH. Abnormal blood pressure response and marked ischemic ST-segment depression as predictors of severe coronary artery disease. Circulation, 1980, 61:572–8
- Taylor AJ, Beller GA. Postexercise systolic blood pressure response: association with the presence and extent of perfusion abnormalities on thallium-201 scintigraphy. American heart journal, 1995, 129:227–34.
- Cole CR et al. Heart-rate recovery immediately after exercise as a predictor of mortality. New England journal of medicine, 1999, 341:1351–7.
- Morise AP, Duval RD. Accuracy of ST/heart rate index in the diagnosis of coronary artery disease. American journal of cardiology, 1992, 69:603–6.
- Kligfield P, Ameisen O, Okin PM. Heart rate adjustment of ST segment depression for improved detection of coronary artery disease. Circulation, 1989 Feb, 79:245–55.
- Okin PM, Kligfield P. Heart rate adjustment of ST segment depression and performance of the exercise electrocardiogram: a critical evaluation. Journal of the American College of Cardiology, 1995, 25:1726–35.
- Lee JH, Crump R, Ellestad MH. Significance of precordial T-wave increase during treadmill stress testing. American journal of cardiology, 1995, 76:1297–9.
- Chikamori T et al. Diagnostic significance of deep T-wave inversion induced by exercise testing in patients with suspected coronary artery disease. American journal of cardiology, 1992, 70:403–6.
- Pandya A, Ellestad MH, Crump R. Time course of changes in P-wave duration during exercise. Cardiology, 1996, 87:343–6.
- Nohara R et al. Septal Q-wave in exercise testing: evaluation by single-photon emission computed tomography. American journal of cardiology, 1985, 55:905–9.
- Ellestad MH, Lerman S, Thomas L. The limitations of the diagnostic power of exercise testing. American journal of noninvasive cardiology, 1989, 3:139–46
- Stoletniy LN, Pai RG. Value of QT dispersion in the interpretation of exercise stress test in women. Circulation, 1997, 96:904–10.
- Struthers AD et al. QT dispersion and triple-vessel coronary disease. Lancet, 1997, 349:1174–5.
- Greenberg PS, Friscia DA, Ellestad MH. Predictive accuracy of Q-X/Q-T ratio, Q-Tc interval, S-T depression and R wave amplitude during stress testing. American journal of cardiology, 1979, 44:18–23
- O’Rourke RA, Schlant, Douglas JS. Diagnosis and management of patients with chronic ischemic heart disease. In: Fuster V et al., eds. Hurst’s The heart. New York, McGraw-Hill, 2001:1207–36.
- Bruce RA, Hornsten TR. Exercise stress testing in evaluation of patients with ischemic heart disease. Progress in cardiovascular diseases, 1969; 11:371–90.
- Rywik TM et al. Independent prognostic significance of ischemic ST-segment response limited to recovery from treadmill exercise in asymptomatic subjects. Circulation, 1998, 97:2117–22.
- Sansoy V, Watson DD, Beller GA. Significance of slow upsloping ST-segment depression on exercise stress testing. American journal of cardiology, 1997, 79:709–12
- Desai MY et al. Slow upsloping ST-segment depression during exercise: does it really signify a positive stress test? American heart journal, 2002, 143:482–7.
- Mayuga KA et al. Effects of age and gender on the QT response to exercise. American journal of cardiology, 2001, 87:163–7.
- Egloff C et al. Sensitivity, specificity and predictive accuracy of Q wave, QX/QT ratio, QTc interval and ST depression during exercise testing in men with coronary artery disease. American journal of cardiology, 1987, 60:1006–8.
- Ulgen MS et al. Contribution of the peak exercise QT dispersion to the accuracy of an exercise test during the evaluation of coronary artery disease. Acta cardiologica, 2000, 55:335–9.
- Koide Y et al. Usefulness of QT dispersion immediately after exercise as an indicator of coronary stenosis independent of gender or exercise-induced ST-segment depression. American journal of cardiology, 2000, 86:1312–7.
- Koide Y et al. Use of QT dispersion measured on treadmill exercise electrocardiograms for detecting restenosis after percutaneous transluminal coronary angioplasty. Clinical cardiology, 1999, 22:639–48.
- Aytemir K et al. QT dispersion plus ST-segment depression: a new predictor of restenosis after successful percutaneous transluminal coronary angioplasty. Clinical cardiology, 1999, 22:409–12.
- Ozdemir K et al. New parameters in the interpretation of exercise testing in women: QTc dispersion and QT dispersion ratio difference. Clinical cardiology, 2002, 25:187–92.