N.M.M. Moharram,1 R. El Aouad,2 S. Al Busaidy,3 A. Fabricius,4 S. Heller,5 W.G. Wood,6 H.U. Wolf7 and C.C. Heuck8
ABSTRACT Accurate, economical methods for haemoglobin determination by laboratories in countries with limited resources are not available. This report provides the results of an international collaborative study evaluating the alkaline haematin detergent (AHD575) method as a reference method for laboratory services with limited resources. The study included 6 laboratories; 3 in East Mediterranean countries, 1 in East Africa and 3 in Europe. The (AHD575) method was evaluated against the HiCN method, with blood samples drawn from healthy and sick subjects. The results indicate that the AHD575 method is suitable for measuring haemoglobin in laboratories at all levels.
Étude collective internationale d’évaluation de la méthode de l’hématine alcaline D-575 pour la mesure de l’hémoglobine sanguine
RÉSUMÉ Des méthodes précises et économiques pour la détermination de l’hémoglobine par les laboratoires dans les pays qui ont des ressources limitées ne sont pas disponibles. Cet article présente les résultats d’une étude collective internationale qui évalue la méthode de l’hématine alcaline D-575 comme méthode de référence pour les services de laboratoire dont les moyens sont limités. L’étude comprenait 6 laboratoires : 3 dans des pays de la Méditerranée orientale, 1 en Afrique orientale et 3 en Europe. La méthode de l’hématine alcaline D-575 a été évaluée par rapport à la méthode de la cyanméthémoglobine (HiCN) sur des échantillons sanguins prélevés sur des sujets sains et malades. Les résultats indiquent que la méthode de l’hématine alcaline D-575 convient pour mesurer l’hémoglobine dans les laboratoires à tous les niveaux.
1Central Public Health Laboratory, Cairo, Egypt.
2Institut National d´Hygiene, Rabat, Morocco.
3Central Public Health Laboratory, Muscat, Oman.
4St Benedict’s Hospital, Ndanda, Tanzania.
5Gertrauden Hospital, Berlin, Germany.
6INSTAND WHO Collaborating Centre, Düsseldorf, Germany.
7Formerly of the University of Ulm, Ulm, Germany.
8University Hospital Düsseldorf, Germany (Correspondence to: C.C. Heuck:
This e-mail address is being protected from spambots. You need JavaScript enabled to view it
).
Received: 17/03/05; accepted: 26/05/05
EMHJ, 2006, 12(6): 722-734
Introduction
During a meeting in Geneva on September 2002, the World Health Organization (WHO) Working Group on Anaemia noted that blood haemoglobin determination for diagnosing and monitoring treatment of anaemia in populations of countries with limited resources is still an unsolved problem. In 1967, the International Council for Standardization in Haematology (ICSH) recommended the haemoglobin cyanide (HiCN) method as the reference method for use [1]. Measurement is made at 540 nm. The reaction takes about 4 minutes [2]. In fact, the end point of the reaction may not be reached before 90 to 120 minutes [3]. Moreover, the method is sensitive to turbidity at high protein concentrations.
A more sophisticated, integral method measures the absorption of HiCN between 500 nm and 600 nm [4]. For routine use, this method is suitable for automated equipment only.
In 1985 WHO established the second haemoglobin cyanide reference material [5] and recommended the HiCN method be given the status of an international reference procedure. Historically, it is interesting to note that the establishment of the standard was not based on results of an international collaborative study nor did it make reference to a first WHO standard, which never existed.
Despite its deficiencies, the use of the HiCN method improved haemoglobin measurement in laboratories using automated techniques. However, most laboratories in countries with limited resources have not benefited from this development. On the contrary, it appears that the accuracy of haemoglobin measurement in these countries has detiorated, because the HiCN method is associated with too many constraints. Reports from Africa reveal that haemoglobin measurement has the poorest precision and reproducibility among all common laboratory indicators [6].
There are various reasons that explain these developments:
- Simple analytical instruments for haemoglobin measurement using the HiCN method, appropriate at the primary level, are not available.
- The toxicity of the reagents for the HiCN method causes major problems in procurement and disposal. As a result, the importation of these chemicals is restricted in many countries.
- Certified calibrators for the HiCN method are not readily available.
- Laboratories have resorted to using alternative visual comparator methods (Lovibond, Sahli, Talquist and corresponding techniques) which are cheap but highly inaccurate [7].
Other methods for haemoglobin measurement have been developed to overcome the disadvantages of the HiCN method. In the haemoglobin azide method measurement is made at 570 nm [8]. However, in some countries importation of azide is also restricted. Today, the method is used only in commercial systems using unit-dose reagents.
In the sodium dodecyl sulfate/sodium lauryl sulfate (SDS; SLS) method, the anionic detergent forms a complex with haemoglobin, the optical density of which is measured at 555 nm [9]. The method is used in automated analyzers.
In certain automated systems quaternary ammonium detergents are used. The method has not been published. However, it appears that the method correlates poorly with the HiCN and SLS methods.
In the oxyhaemoglobin method, haemoglobin is measured at 540 nm or 577 nm. The method suffers from the development of nonspecific turbidity caused by protein precipitates and a decay of haemoglobin in the ammonia diluent solution. In addition, there is no reference material available for oxyhaemoglobin.
In the alkaline haematin detergent (AHD575) method, red blood cells are lysed with Triton X-100 and sodium hydroxide (NaOH) at pH 13, which converts haemoglobin to haematin forming a stable complex with Triton X-100 [10]. The optical density of haematin is measured at 575 nm to 578 nm. Measurement can also be carried out at 540 nm and 546 nm.
Another method uses 60% ethanol (final concentration) to shift the maximum of absorption of haemoglobin to higher wavelengths, and optical density is measured at 600 nm [11]. The method has not been evaluated on a large scale. The use of ethanol in large amounts does not seem to render the method suitable for laboratories in countries with limited resources.
Haemoglobin is also indirectly determined using the concentration and mean corpuscular volume (MCV) of erythrocytes. This method does not require a haemoglobin reagent, but the number of red blood cells and MCV must be measured using a blood cell counter [12].
Among the existing direct methods for haemoglobin measurement the AHD575 method seems to be most suitable. The African Medical and Research Foundation (AMREF, Nairobi) assessed the method under field conditions in East Africa and obtained encouraging results [13]. The observations led the WHO Working Group on Anaemia to recommend an international collaborative study comparing the AHD575 method with the HiCN method with the possibility in mind of replacing the current international reference method with a method with properties that are widely acceptable and that can be used by laboratories at all levels.
This paper reports the results of the collaborative study.
Study design
The study was planned in early 2003 and conducted from 2003 to 2005. Originally, laboratories from all WHO regions were invited to participate. The selection of the laboratories was based on previous communication with WHO/HQ. All laboratories had a supervising function in their own country. The aim was to include at least 500 measurements to provide a basis of data for a sound statistical evaluation. When the study began, 7 laboratories had agreed to participate; 3 were located in East Mediterranean countries, 2 in East Africa, and 3 in Europe. One laboratory withdrew from the study because of logistical reasons.
Six laboratories were asked to measure haemoglobin from fresh blood from at least 60 healthy and diseased individuals. The participating laboratories were also asked to assess the imprecision of measurement of the AHD575 method.
Blood samples were randomly taken from healthy subjects and patients who suffered from a variety of disorders, including infections, cancer, systemic diseases, organ failure and metabolic diseases. Most of the patients had received drug treatment.
The laboratories reported their results in terms of optical densities and haemoglobin concentrations to the coordinator of the study.
Methods
To ensure that all participating laboratories used the same calibrator, one laboratory in Germany prepared the reagents for the AHD575 method using NaOH and Triton X 100 (Merck GmbH, Darmstadt, Germany) and shipped the reagents to the participating laboratories. This laboratory also prepared sealed ampoules containing highly purified haemin chloride (purity 99.6%; Roth, Karls-ruhe/Germany, Cat. No 7629) dissolved in the AHD reagent corresponding to 30 g/L, 60 g/L, 90 g/L, 120 g/L,150 g/L and 180 g/L haemoglobin (final concentration after dilution 151:1 v/v) for the calibration of measurement. These solutions were mailed to the participating laboratories. In addition the laboratories received the 6th WHO haemoglobincyanide standard (code 98/708; NIBSC, Potters Bar, United Kingdom) for the calibration of the HiCN method.
Another laboratory compared the absorption spectra of haemoglobin cyanide, haematin and lysed erythrocytes. Two millilitres of packed erythrocytes were suspended in 8 mL of 0.15 mol/L NaCl and centrifuged for 5 min at 2000 g. The supernatant and the upper layer including the white blood cells were discarded and the erythrocytes resuspended in 8 mL of 0.15 mol/L NaCl. The procedure was repeated 7 times. To 0.5 mL of the final preparation of the washed, packed erythrocytes, 0.5 mL of distilled water was added and the mixture sonicated for 10 minutes. The lysed erythrocytes were used for the spectral measurements using a JASCO V550 photometer (Grossumstadt, Germany).
The kinetics of reaction of the HiCN method and the AHD575 method were measured at 540 nm and 575 nm respectively. The measurements were made using reagents that were prepared with distilled water and 0.15 mol/L NaCl.
The stability of haemin was examined by repeated measurements of dilutions of 20 blood samples. The dilutions were kept in covered plastic vials at room temperature and at 4 °C for 72 hours.
The effect of leukocyte concentration on HiCN and AHD measurement was examined in selected blood samples.
In additional experiments the effect of non-purified water on the AHD-measurement was examined. In one series of measurements tap water was used, in another series the water was taken from a river. The water from the river was cleaned of floating microparticles using a simple filtration procedure. About 500 g of yellow-white silica sand from the river with particle sizes less than 4 mm was washed 5 times with 3 L of tap water. About 100 g of the washed sand was filtered through two layers of filter paper (Schleicher & Schuell filter paper no. 595 1/2) placed in a funnel. The water from the river was filtered through the sand and left for 48 hours for settling of residual microparticles that adsorbed to the walls of the glass beaker. Centrifugation of the filtered water was deliberately omitted assuming that in many peripheral laboratories a centrifuge is not available. The filtered water was used for the preparation of the AHD575 reagent solution.
All laboratories used manual methods. The reagents for the determination of HiCN were supplied from local commercial sources; the reagents for the AHD575 method were supplied centrally for the study. The dilution of the blood samples for the HiCN measurement was 251:1 [1]. Optical density was measured at 540 nm or 546 nm. In the AHD575 method, 20µL of blood were mixed with 3 mL of the AHD reagent (0.1 mol/L NaOH in 1 g Triton X-100/100 mL water) corresponding to a dilution of 151:1 [10]. Optical densities of the haemin concentrations were routinely measured at 540 nm or 578 nm. The photometers used were from different manufacturers.
Optical densities of the HiCN measurements were multiplied by the absorption factors f = 368 or f = 370 for measurements at 540 nm and 546 nm respectively to obtain the haemoglobin concentrations. For AHD measurements at 540 nm, 546 nm and 578 nm the absorption factors f = 494, f = 482 and f = 350 respectively were used.
Each series of measurements was analysed using the Passing–Bablok method to assess the linearity and correlation of the optical densities as well as the reported haemoglobin concentrations [14].
Results
Absorption spectra
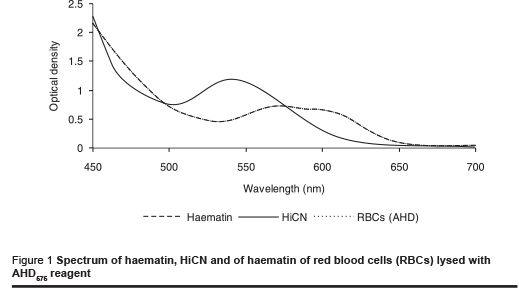
The absorption spectra of haemin and of lysed erythrocytes were compared to assess the possible effect of other components in red blood cells on light adsorption. Therefore a solution of lysed erythrocytes with the same optical density at 575 nm as a haemin solution corresponding to 180 g/L haemoglobin was prepared. The spectra correlated exactly at all wavelengths (Figure 1). Their identity indicates that there were no other components of erythrocytes contributing to absorption to a significant extent. Washed and lysed erythrocytes are obviously suitable for calibration of the AHD575 method for measurement at various wavelengths.
Kinetics
The kinetics of reaction of the HiCN method and the AHD575 method are remarkably different (Figures 2a & b). The sharp fall of optical density during the first few seconds is caused by the lysis of the cells. The conversion of haemoglobin to HiCN is not completed after a reasonable period of time. The presence of NaCl at physiological concentration accelerates the kinetics of the reaction. Still, the reaction takes at least 4 minutes for completion.
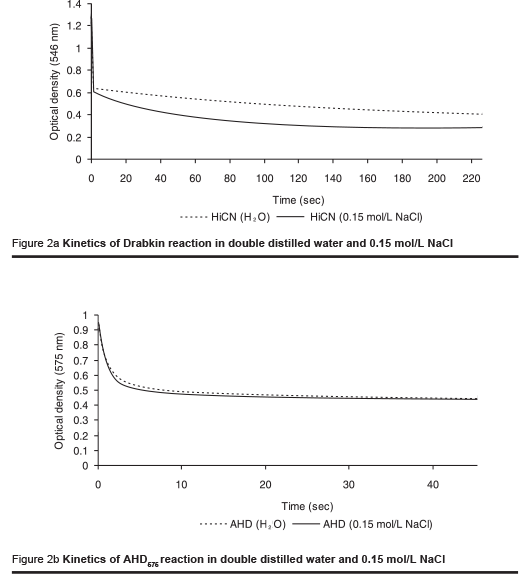
In the AHD575 method the conversion of haemoglobin to haemin is completed between 30 and 60 seconds. The reaction is not affected in the presence of physiological saline concentrations.
The course of the kinetics indicates that the AHD575 method offers practical advantages compared with the HiCN method:
- The reaction is faster;
- It does not necessitate the use of distilled water, and water containing salts at low concentrations is equally suitable for the preparation of the reagent.
Imprecision
The laboratories reported coefficients of variation for imprecision of the AHD575 method varying between 0.4% and 2.3%.
Stability
The haemin dilutions of 20 blood samples were measured at regular intervals for the assessment of stability. The changes of optical densities at different time intervals compared to the first series of measurements are shown in Table 1.
Storage at room temperature increased the optical density of HiCN dilution. This was probably caused by turbidity from precipitated proteins. By contrast, the optical density of haemin dilutions decreased by 4.3% after storage at room temperature. The decrease is caused by a breakdown of haemin in solution. The HiCN and haemin dilutions were less affected by storage at 4 °C. The changes observed are within the error of repeatability of measurement.
Effect of leukocytes
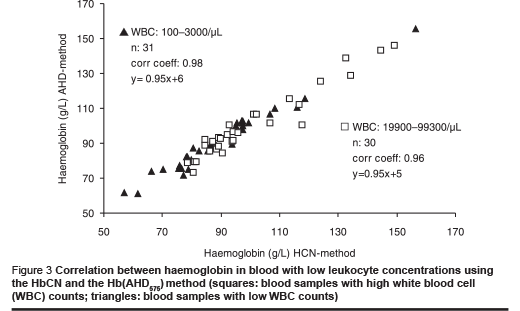
The possible effect of leukocyte counts on haemoglobin measurement was examined by comparing the correlation and regression from a series of blood samples with low leukocyte counts (0 to1000 white blood cells/µL) and from another series of blood samples with high leukocyte counts (25 000 to 100 000 white blood cells/µL).
The regression of both series of measurements was identical (Figure 3); the correlation of the series with high leukocyte counts was slightly less than that of the series with low leukocyte counts. We attribute this lower correlation to pipetting errors that may be more pronounced in these samples.
Correlations
The correlations between the HiCN method and the AHD575 method were calculated from the optical densities. The Passing–Bablok analysis revealed a linear relationship between the two measurement methods for all series which were reported. The correlations are listed in Table 2.
One laboratory reported results with a correlation coefficient of 0.91 and a lower slope of the regression curve. The scattering of results indicated that the laboratory seemed to have problems using the manual procedure. The other laboratories reported results with a high correlation (> 98%). The correlation coefficient for all results combined (n = 1107) was r = 0.98 (Figure 4).
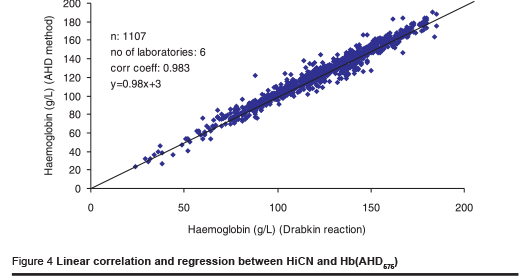
Considering a difference of 10 g/L as an acceptable limit of agreement between the 2 methods, 5.6% of the results were beyond that limit. However, 75% of the differences of measurement that were beyond the limit were reported in one series. This indicates that differences observed are caused by pipetting errors.
The correlation of haemoglobin concentrations, which were read from calibration curves, were as good as the results for the haemoglobin that were determined from the reported optical densities using specific absorption factors (f = 350 at 578 nm, f = 482 at 546 nm or f = 494 at 540 nm for blood diluted 152:1 with the AHD reagent). In this way the daily preparation of a calibration curve can be avoided, once the accuracy of measurement using a specific photometer has been verified.
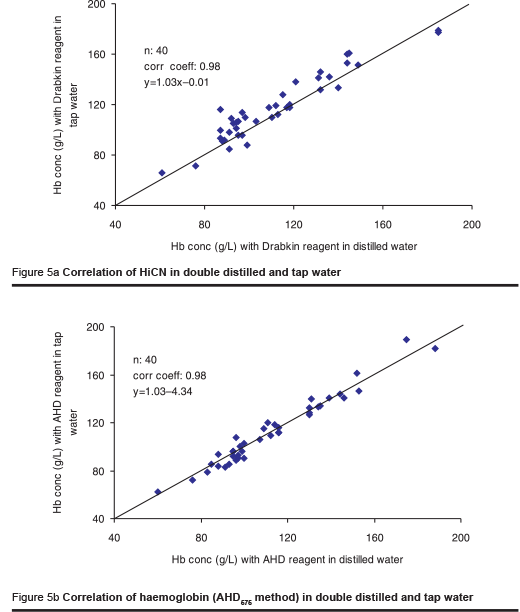
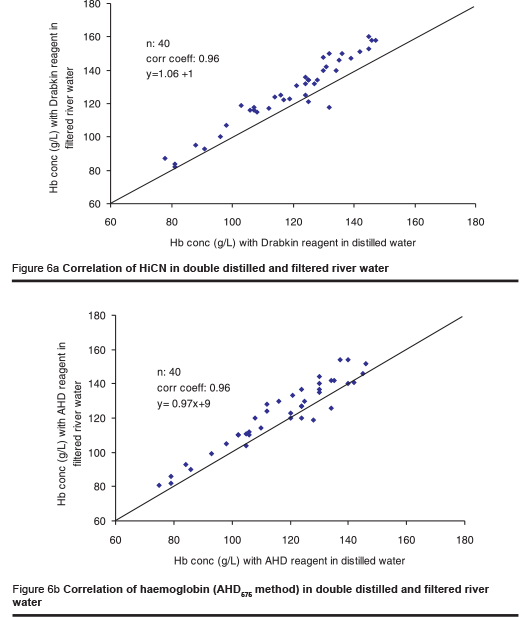
As the availability of distilled water may often be limited, one laboratory investigated the effect of tap water and river water on the HiCN and the AHD575 methods. The river water was filtered using a rather primitive technique to remove microparticles. The osmolality of the tap water and the river water was 10 mOsmol/kg and 11 mOsmol/kg respectively. The tap water and the filtered river water were used for the preparation of the AHD reagent. Measurement was made in 2 series, each including 40 blood samples.
In contrast to the Drabkin reagent for HiCN measurement, the AHD reagent prepared from tap water yielded identical results to those obtained with distilled water (Figures 5a & b). The results were slightly higher when using the reagent prepared from filtered river water (Figures 6a & b). The difference is attributed to microparticles in the solution that were not completely removed by the primitive method of filtration used. The results are still better than those obtained using any filter paper method [6].
Discussion
The major constraints limiting the measurement of haemoglobin in laboratories in countries with limited resources are the following:
- lack of reagents
- lack of a reference material
- lack of appropriate equipment.
The chemical components of the AHD575 reagent are cheap. The composition of the AHD575 reagent is not critical, i.e. the concentration of the detergent may vary within a certain limit and the NaOH can be replaced by potassium hydroxide without affecting the performance of the method. The flexibility in the preparation of the reagent offers practical advantages. A laboratory can easily prepare the AHD575 reagent using components that are locally available. By contrast, the Drabkin reagent used for the HiCN measurement is more complex and a change in the composition of the reagent causes a variation in the results of measurement.
The majority of laboratories determine haemoglobin using the specific absorption factor at a given wavelength rather than establishing a calibration curve because there is no crystalline reference material available for the HiCN method. The WHO HiCN standard material is only provided to reference laboratories, and its use has been rather limited. In fact, the need for the provision of a WHO reference material for HiCN may be questioned, since such a material can only be used for the HiCN method and not for other methods for haemoglobin determination.
For the calibration of the AHD575 method, pure crystalline haemin chloride is commercially available so that a reference standard can be locally prepared. Moreover, the AHD575 method is suitable for the control of other methods, including the oxyhaemoglobin and the SLS method. The addition of NaOH converts the light absorbing products that were formed by these reagents into haemin, the measurement of which can be verified with a haemin chloride calibration curve.
Methodological features that distinguish the AHD575 method from the HiCN reference method are the following:
- Measurement is recommended at 575 nm or 578 nm wavelength. At this wavelength the background absorption is lower than at 540 nm and non-specific turbidity effects are less. In addition, bilirubin does not interfere with light absorption. Therefore, high bilirubin concentrations do not cause falsely elevated blood haemoglobin concentrations.
- High plasma lipoprotein concentrations may increase light absorption non-specifically in the HiCN method. The reaction medium of the AHD575 method is alkaline (pH = 13). At this pH, lipids of plasma lipoproteins do not coalesce, since lipoproteins are efficiently disintegrated by Triton X-100 and lipids are hydrolysed. This explains why elevated lipoprotein concentrations do not interfere with accurate haemoglobin measurement.
The endpoint of reaction of the AHD575 method is reached within 1 minute or less. This makes the method suitable for adaptation to automated measurement.
In summary, the AHD575 method overcomes major constraints of the HiCN method, including the provision of chemicals that are needed for local preparation of the reagent, and a chemically well-defined calibrator material that is commercially available. The method is suitable and cheap. These properties place the AHD575 method in the first line for use as a reference and a routine method.
Acknowledgement
The authors would like to thank Dr J. Carter, Nairobi for reviewing the manuscript.
References
- International Committee for Standardisation in Haematology of the European Society of Haematology. Recommendations and requirements for hemoglobinometry in human blood. Journal of clinical pathology, 1965, 18:352–5.
- Van Kampen EJ, Zijlstra WG. Determination of hemoglobin and its derivates. Advances in clinical chemistry, 1965, 8:141–87.
- Rodkey FL. Kinetic aspects of cyanmet-hemoglobin formation from carboxyhemoglobin. Clinical chemistry, 1967, 13:2–5.
- Von Felten U et al. Prüfung einer neuen Methode zur Hämoglobinbestimmung in mechanisierten Analysegeräten. [Testing a new method of hemoglobinometry in mechanized analytic apparatus.] Das Medizinische Laboratorium, 1978, 31:223–36.
- Recommendations for reference method for haemoglobinometry in human blood (ICSH standard 1986) and specifications for international haemiglobincyanide reference preparation (3rd edition). International Committee for Standardization in Haematology; Expert Panel on Haemoglobinometry. Clinical and laboratory haematology, 1987, 9:73–9.
- Medina Lara A et al. Evaluation and costs of different haemoglobin methods for use in district hospitals in Malawi. Journal of clinical pathology, 2005, 58:56–60.
- Van Leberghe W et al. Haemoglobin measurement: the reliability of some simple techniques for use in a primary health care setting. Bulletin of the World Health Organization, 1983, 61:957–65.
- Vanzetti G. An azide–methemoglobin method for hemoglobin determination in blood. Journal of laboratory and clinical medicine, 1966, 67:116–21.
- Oshiro I et al. [New manual and automatic method of hemoglobin determination by using SLS (author’s transl).] Rinsh byori, 1981, 29:203–9 [in Japanese].
- Zander R, Lang W, Wolf HU. Alkaline haematin D-575, a new tool for the determination of haemoglobin as an alternative to the cyanhaemiglobin method. I. Description of the method. Clinica chimica acta, 1984, 136:83–93.
- Suzuki Y. Determination of human hemoglobin in blood based on its spectral change due to the solvent effect of ethanol. Analytical sciences (Jap), 1998, 14:1013–6.
- Kalache GR, Sartor MM, Hughes WG. The indirect estimation of hemoglobin concentration in whole blood. Pathology, 1991, 23:115–7.
- Lema OE et al. Evaluation of the alkaline haematin D-575 method for haemoglobin estimation in East Africa. Bulletin of the World Health Organization, 1994, 72:937–41.
- Passing H, Bablok W. A new biometrical procedure for testing the quality of measurements from two different analytical methods. Journal of clinical chemistry and clinical biochemistry, 1983, 21:709–20.


